Semrush Newsroom logo
  • Features
  • Pricing
  • Resourcesarrow icon

    • Blog

      Read the industry's latest thoughts on digital marketing, content strategy, SEO, PPC, social media and more.

    • Help Center

      Learn how to use Semrush with user manuals, how-to’s, videos and more!

    • What's New

      Keep track of the newest Semrush features and improvements.

    • Webinars

      Register and take part in educational webinars conducted by the best digital marketing experts.

    • Ebooks

      A range of downloadable guides in PDF format that can help you broaden your knowledge and improve your skills.

    • Hire a Trusted Agency

      Pressed for time? Need rare skills? Get help from a trusted agency. Our experts work with marketing projects of all kinds and budgets.

    • Academy

      Get vital SEO skills, learn how to use our toolkits and get official certificates of your proficiency in SEO and Semrush.

    • Top Websites

      Discover the most visited websites. Analyze their traffic and search rankings. Choose country or industry to find out who currently leads the market.

  • Companyarrow icon

    • About Us
    • Newsroom
    • Careers
    • Success Stories
    • Data Studies
    • Affiliate Program
    • For Investors
    • Partner Integrations
    • Contacts
    • Stats and Facts
  • Marketplace
Menumenu icon
user icon
menu icon
  • News
  • Data & Insights
  • Company News
  • Product News
  • Press Kit
Search icon
  • Features
  • Pricing
  • Resourcesarrow icon

    • Blog
    • Help Center
    • What's New
    • Webinars
    • Ebooks
    • Hire a Trusted Agency
    • Academy
    • Top Websites
  • Companyarrow icon

    • About Us
    • Newsroom
    • Careers
    • Success Stories
    • Data Studies
    • Affiliate Program
    • For Investors
    • Partner Integrations
    • Contacts
    • Stats and Facts
  • Marketplace
Semrush Newsroom logo
  • News
  • Data & Insights
  • Company News
  • Product News
  • Press Kit
✕
Main page /Data & Insights

Semrush Study: Super Bowl Ads Are No Longer a One-Night Event

February 13, 2026
Semrush Study: Super Bowl Ads Are No Longer a One-Night Event

What social engagement, search behavior, and AI-generated answers reveal about who really won the up-to-$10M ad battle

Super Bowl advertising brings the same amount of hype and reach for marketers as the game does for sports fans. It’s unmatched. This year, we saw that reach alone no longer defines success. The real competition now plays out across days and platforms, with audiences revisiting ads on social media, searching for explanations and rankings, and increasingly turning to AI tools to summarize what mattered.
To understand which brands actually captured attention on Super Bowl the the days after, Semrush analyzed multiple visibility signals at once: social media engagement, search and traffic behavior, and how often brands appear in large language model (LLM) responses to prompts related to “Super Bowl ads.” Together, these signals show how brand visibility is created and sustained well beyond the broadcast itself.

Takeaways: What Winning a Super Bowl Ad Looks Like in 2026

1. Engagement separated impact from exposure.
Michelob Ultra drove 58M YouTube views but only ~150 engagements, while Pepsi paired 51.1M views with 10.5K engagements and 443K total social interactions. Reach was common. Resonance wasn’t.
2. Traffic didn’t automatically follow airtime – even on game day.
State Farm and Toyota saw traffic drop more than 30% on February 8 versus their pre-game daily averages, while Poppi surged 249% and Michelob Ultra rose 81%. Only brands tied to real-time consumption reliably converted awareness into visits.
3. AI visibility favored brands that stayed in the narrative, not just advertisers.
Across 637 LLM mentions, the top five brands captured 18.5% of visibility, led by YouTube (33 mentions) and Coffee Mate (22). In AI-generated answers, being “top of mind” increasingly means being part of the stories people keep asking about – rankings, debates, and media coverage – not just buying airtime.

Super Bowl Ads as a Visibility Test

Historically, Super Bowl ads were judged through recall surveys and post-game buzz. That approach assumed attention was short-lived and linear. Today, attention is fragmented and recursive. Viewers don’t just watch ads; they look them up, share them, criticize them, and ask AI assistants to explain or rank them.As a result, Super Bowl advertising has become a visibility test rather than a visibility moment. Brands that fail to generate follow-on activity often disappear from the conversation quickly, regardless of production quality or media spend.

Social Engagement Shows Who Sparked Continued Interest

Social media data from Super Bowl week shows how uneven attention really is once the game ends. While many brands saw short-term spikes, only a small group translated exposure into meaningful follower growth and engagement across platforms including Facebook, Instagram, X, TikTok, and YouTube.
Between February 2–8, a handful of brands stood out for net new follower growth: Pepsi with +171K followers, Budweiser with +38K, OpenAI with +36K and Dove with +18K.
Superbowl-Statictic-01.png
The spread is telling. Pepsi and Budweiser came in with their  familiar Super Bowl advertising approaches, while tech like OpenAI and Gemini appearing underscore the everyday relevance of tech alongside traditional consumer goods. 

YouTube Extends Reach — Engagement Signals Impact

YouTube significantly extends the lifespan of Super Bowl ads, but views alone proved misleading. The most-viewed commercial, Michelob Ultra, reached 58M views yet generated only ~150 engagements, indicating heavy paid distribution with limited organic interaction.
Superbowl-Statictic-02.png
By comparison, Pepsi’s ad reached 51.1M views and drove 10.5K engagements, signaling far stronger audience response relative to reach. The gap underscores a clear shift: replay volume no longer equals impact. Engagement is now the more reliable signal of resonance.

Total Engagement Shows Who Actually Won

When engagement across Facebook, Instagram, X, TikTok, and YouTube is combined, a different leaderboard emerges, one shaped by sustained interaction rather than exposure alone.
Top brands by total social engagement (Feb 2–8):
  • Pepsi: 443K
  • Dunkin’: 357K
  • State Farm: 252K
  • Pringles: 242K
  • Poppi: 208K
This group includes both Super Bowl mainstays and newer, digitally native brands. What connects them isn’t production scale, but post-game momentum: content that continued to be shared, discussed, and rediscovered across platforms. In 2026, winning attention requires cross-platform, multi-day visibility, not a single viral moment.

Search Data Reveals What Viewers Wanted to Understand

Contrary to expectations, Super Bowl Sunday did not produce universal traffic surges across advertisers. In fact, many large brands saw declines compared to the week prior. Insurance, automotive, fintech, and real estate advertisers recorded double-digit drops in site traffic on February 8.
Superbowl-Statictic-04.png
For example, State Farm and Toyota both experienced declines of more than 30% compared to their pre-game daily averages. Even high-traffic platforms such as ChatGPT saw a 24% dip on game day.
The exceptions were brands closely tied to real-time consumption. Poppi saw a 249% surge versus its prior daily average, while Michelob Ultra rose 81%. Uber Eats increased 35%, reflecting clear alignment with game-day behavior.
The data suggests a structural pattern: Super Bowl advertising does not automatically translate into immediate website visits. Instead, traffic spikes are most pronounced when the product category aligns directly with live consumption or transactional intent.

What AI Surfaces When People Ask About Super Bowl Ads

As discovery increasingly happens inside AI-generated answers, brand visibility now depends on whether companies appear in those responses at all. When users ask LLMs about “Super Bowl ads,” the systems do not simply list advertisers. Instead, they synthesize information from media coverage, search behavior, and social discussion.
Analysis of LLM responses shows that a relatively small group of brands surfaced most frequently. Coffee Mate, YouTube, Michelob Ultra, OpenAI, and T-Mobile ranked among the top brands by mentions, benefiting from both advertising exposure and extensive media coverage. 
Superbowl-Statictic-03.png
At the same time, AI visibility followed a clear long-tail pattern. Out of 637 total brand mentions in the analyzed sample, the top five brands accounted for just 18.5% of mentions, while nearly half of all visibility was spread across dozens of smaller brands and entities. In practice, this means AI-generated answers reflect the broader conversation, not just the biggest advertisers.
Category-level analysis explains why. LLMs frequently associated “Super Bowl ads” with platforms, publishers, health and telehealth brands, and even regulators such as the FDA and FTC. Super Bowl advertising, from an AI perspective, is a media and cultural event as much as a marketing one.

Prompt Patterns Shape AI Visibility

One of the clearest signals from the AI data is that visibility depends heavily on how people ask about ads. Celebrity-focused prompts (“Who’s in this ad?”), controversy-driven questions (“worst Super Bowl ads”), and regulated topics consistently pulled brands into AI responses.
Comparison and ranking prompts expanded visibility further, surfacing multiple brands at once through list-style answers. Platform-focused questions tied Super Bowl ads to YouTube, Google, and AI tools themselves, elevating platforms and publishers alongside advertisers. In AI-driven discovery, brands are no longer competing only for airtime. They are competing to become part of the narratives that users, and AI systems, repeatedly reference.

Methodology & Sources

This analysis combines social engagement data, website traffic behavior, and AI visibility signals to evaluate how brands performed during Super Bowl week (February 2–8, 2026).
Social Media Engagement: Engagement and follower growth data were collected using the Semrush Social Media Toolkit across Facebook, Instagram, X, TikTok, and YouTube. Total engagement reflects aggregated interactions (likes, comments, shares, and platform-equivalent actions) between February 2–8, 2026. YouTube view and engagement metrics reflect publicly available video performance during the same window.
Website Traffic Analysis: Traffic data was sourced from Semrush Traffic Analytics. Game-day performance (February 8, 2026) was compared against each brand’s pre-game daily average during the prior week to measure relative change. Percentage increases or declines reflect estimated total website visits across devices and geographies, unless otherwise specified.
AI Visibility (LLM Analysis): AI visibility data reflects how often brands appeared in large language model (LLM) responses to prompts containing the phrase “Super Bowl ads.” Analysis includes the top 100 brands by mentions as displayed in the Semrush AI Visibility Toolkit interface. Dataset scope: all supported LLMs, United States. Total analyzed sample: 637 brand mentions.
Together, these datasets provide a multi-signal view of brand visibility, spanning engagement, behavioral intent, and inclusion in AI-generated discovery environments.
 

Download as

PDF
DOCX

Share

Relevant news

The Brand Visibility Mandate: Why SEO Must Evolve for the AI Discovery Era

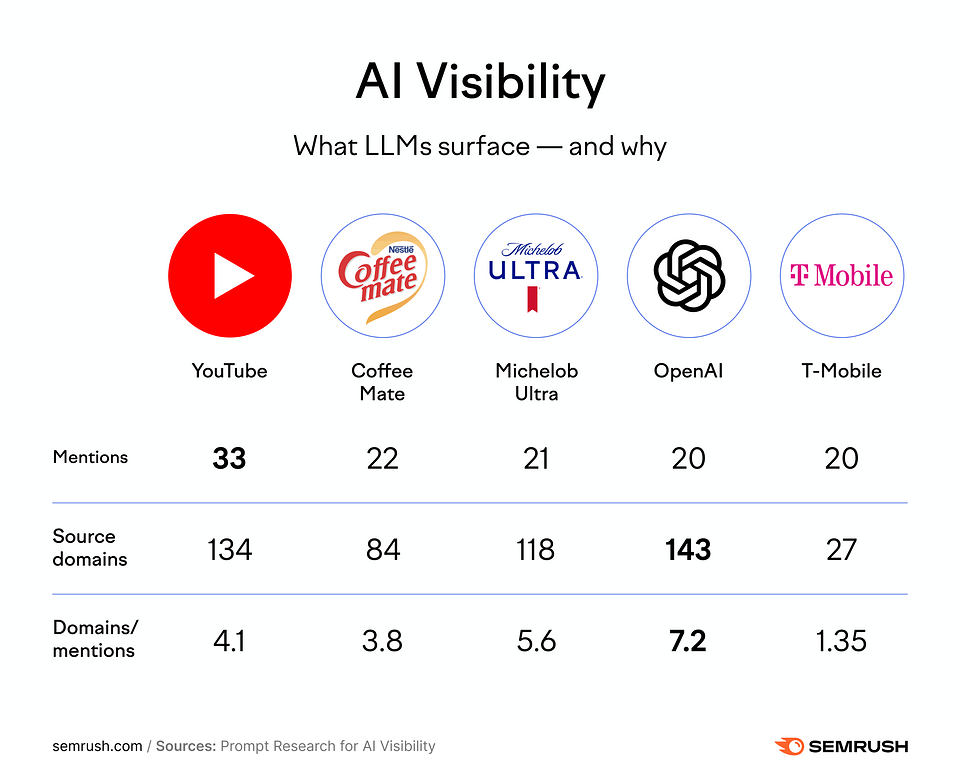
The rules of digital visibility are changing fast. As generative AI engines increasingly shape how people discover, evaluate, and choose brands, traditional SEO metrics alone no longer tell the full story. Rankings still matter, but they are no longer the only gateway to...
Data & Insights
January 27, 2026

Holiday Shopping 2025: What Traffic Data Reveals About Search, AI, and How People Actually Buy

The 2025 holiday shopping season followed a familiar rhythm: early research, a compressed deal frenzy, a deadline-driven December, and then a quiet post-holiday reset. But beneath that familiar shape, Semrush traffic data from 19 of the world’s largest retailers reveals ...
Data & Insights
January 21, 2026

2026 Predictions: The First Year Marketers Must Win Both Worlds — SEO and AI Search

A Visibility Outlook from the Semrush Leadership Team
Data & Insights
December 19, 2025
twitter iconfacebook iconlinkedin iconinstagram iconyoutube iconpinterest icon

location iconUSA, 800 Boylston Street, Suite 2475, Boston, MA 02199

mail iconContact us
USA, 800 Boylston Street, Suite 2475, Boston, MA 02199

or see our plans & pricing

Semrush
  • Features
  • Pricing
  • Success Stories
  • Stats and Facts
  • Insights
  • News
  • Custom Report
Help
  • Knowledge Base
  • Academy
  • Semrush API

Community
  • Semrush Blog
  • Webinars
More Tools
  • Analytics Reports
  • Projects
  • Content Marketplace
  • Agency Partners
  • Affiliate Program
  • SEOquake
  • Sensor
  • Prowly
  • Kompyte
  • App Center
Company
  • About Us
  • Newsroom
  • Careers
  • Partners
  • Legal Info
  • Privacy Policy
  • Security Info
  • Do not sell my personal info
  • For Investors
  • Contact us
Follow Us
  • menu icon
    Twitter
  • menu icon
    Facebook
  • menu icon
    LinkedIn
  • menu icon
    Instagram
  • menu icon
    YouTube
  • menu icon
    Pinterest
Language
  • English
  • Español
  • Deutsch
  • Français
  • Italiano
  • Português (Brasil)
  • Русский
  • 中文
  • 日本語
© 2008 - 2023 Semrush. All rights reserved.